Gold Price Analysis Today August 15, 2025: XAU/USD
By Emily White on August 15, 2025
828 views
Key Takeaways
- Gold price sees a marginal increase, currently trading at $3342.59 as of 07:21 UTC.
- Technical chart shows a descending triangle pattern, signaling potential price volatility.
- The Fear & Greed Index is neutral at 46/100, reflecting a balanced market sentiment.
- A breakout above the descending triangle's upper trendline could lead to a rally towards $3415.
Gold Price Analysis Today August 15, 2025: XAU/USD
Gold is showing slight gains in today's trading session, hovering just above the previous day's close as market participants assess various economic indicators and geopolitical developments. The precious metal's performance is being closely watched as investors seek stability amidst ongoing uncertainties.
Daily Analysis
Yesterday, gold closed at $3338.11. Currently, gold is trading at $3342.59 as of 07:21 UTC, representing a modest increase. This translates to a day's change of $4.485, or a 0.134% gain. While the movement is relatively small, it signals a continuation of the upward trend observed in recent sessions. Investors can set up AI-powered price alerts for gold to stay ahead of the market.
The current reading of the Fear & Greed Index is 46/100, indicating a state of neutrality in market sentiment. This suggests that investors are neither overly fearful nor excessively greedy, leading to a more balanced trading environment. Savvy investors often use tools like compare the historical performance of gold against Silver and the S&P 500 to gain further insight.
Technical Outlook
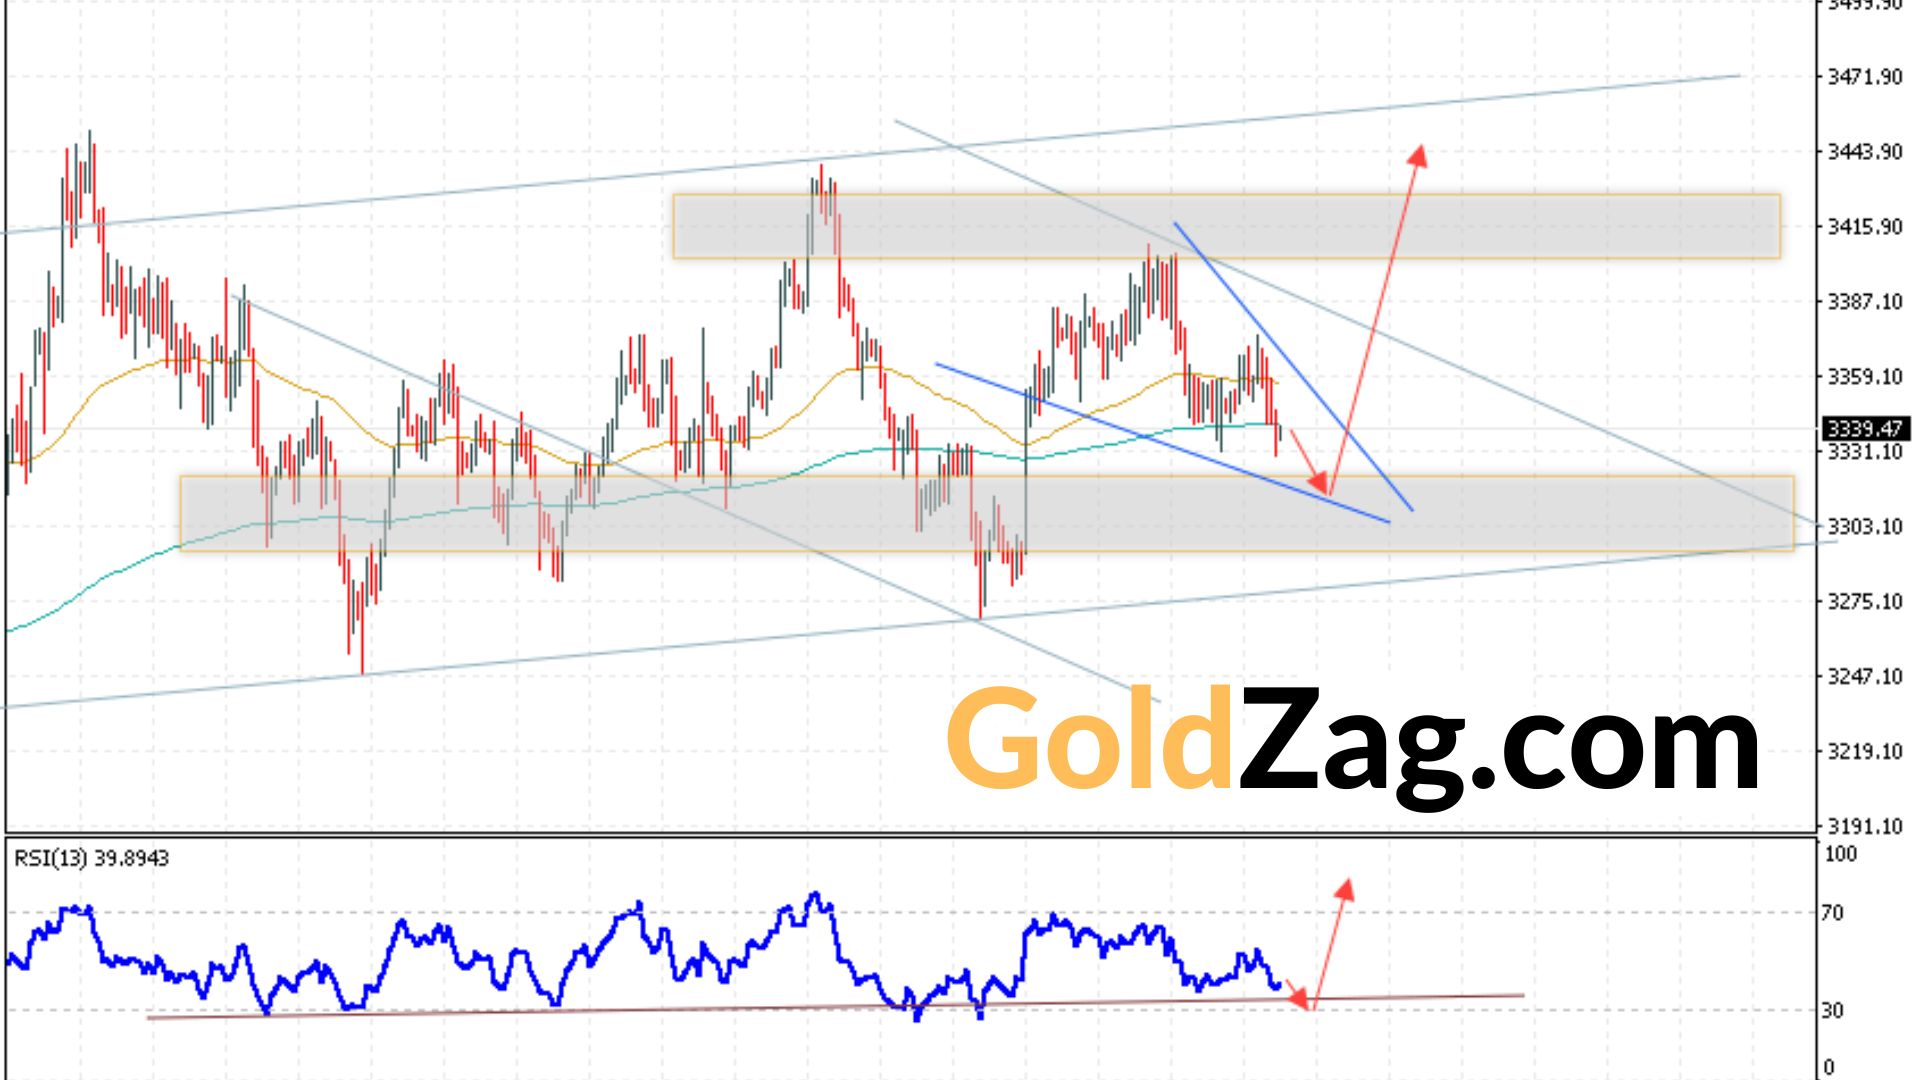
The technical chart reveals that gold is currently trading within a descending triangle pattern. This pattern is characterized by a series of lower highs and a relatively stable support level around the $3300 mark. The price is consolidating near the apex of the triangle, suggesting that a breakout or breakdown is imminent.
The Relative Strength Index (RSI) is hovering around the 40 level, indicating neutral momentum. However, the RSI shows signs of upward divergence, which could signal a potential bullish reversal. A decisive break above the upper trendline of the descending triangle could trigger a rally towards the $3415 level. On the downside, a break below the $3300 support could lead to further declines towards the $3275 level. Understanding our educational hub for learning about gold investment can help investors interpret these technical signals.
Forecast/Outlook
Based on the technical analysis of the chart and the current market data, the outlook for the next trading session is cautiously optimistic. Given the descending triangle pattern and the potential bullish divergence in the RSI, a breakout above the upper trendline is possible. If this occurs, gold could test the $3415 resistance level. However, a failure to break above the trendline could lead to a retest of the $3300 support level.
It is important to note that gold is often considered a safe-haven asset during times of economic uncertainty, which can influence its price movements. Investors should monitor economic news and geopolitical developments closely to assess the potential impact on gold prices.
Automated Internal Linking
You can use our free tool to track the real-time value of your gold investments.
Related Posts
Written by
Emily White
Investment Education Specialist
Emily White is dedicated to demystifying the world of finance for the everyday investor. With a background in both education and personal finance advisory, she excels at breaking down complex topics like portfolio allocation, risk management, and investment product comparison into simple, actionable steps. Emily is the lead creator of the GoldZag Academy, where her work has empowered thousands of new investors to begin their journey into precious metals with confidence and clarity. She is passionate about promoting financial literacy for all.