Gold Price Analysis Today August 19, 2025: XAU/USD
By Emily White on August 19, 2025
1,299 views

Key Takeaways
- Gold is currently trading at $3333.4, slightly down from the previous day.
- Technical indicators suggest a potential bullish reversal with the RSI trending upward.
- The Fear & Greed Index stands at 41/100, indicating moderate fear in the market.
- Monitor key resistance and support levels for potential trading opportunities.
Gold Price Analysis Today (August 19, 2025): Is the Rally About to Begin?
Gold (XAU/USD) is currently trading at $3333.4 (as of 01:37 UTC), a slight dip from the previous day's close of $3335.05. This represents a marginal decrease of $-1.652, or -0.05%. Despite this minor pullback, the underlying technical indicators suggest potential for an upward move, which is also reflected in the Fear & Greed Index which is at 41/100, leaning towards fear.
Technical Outlook
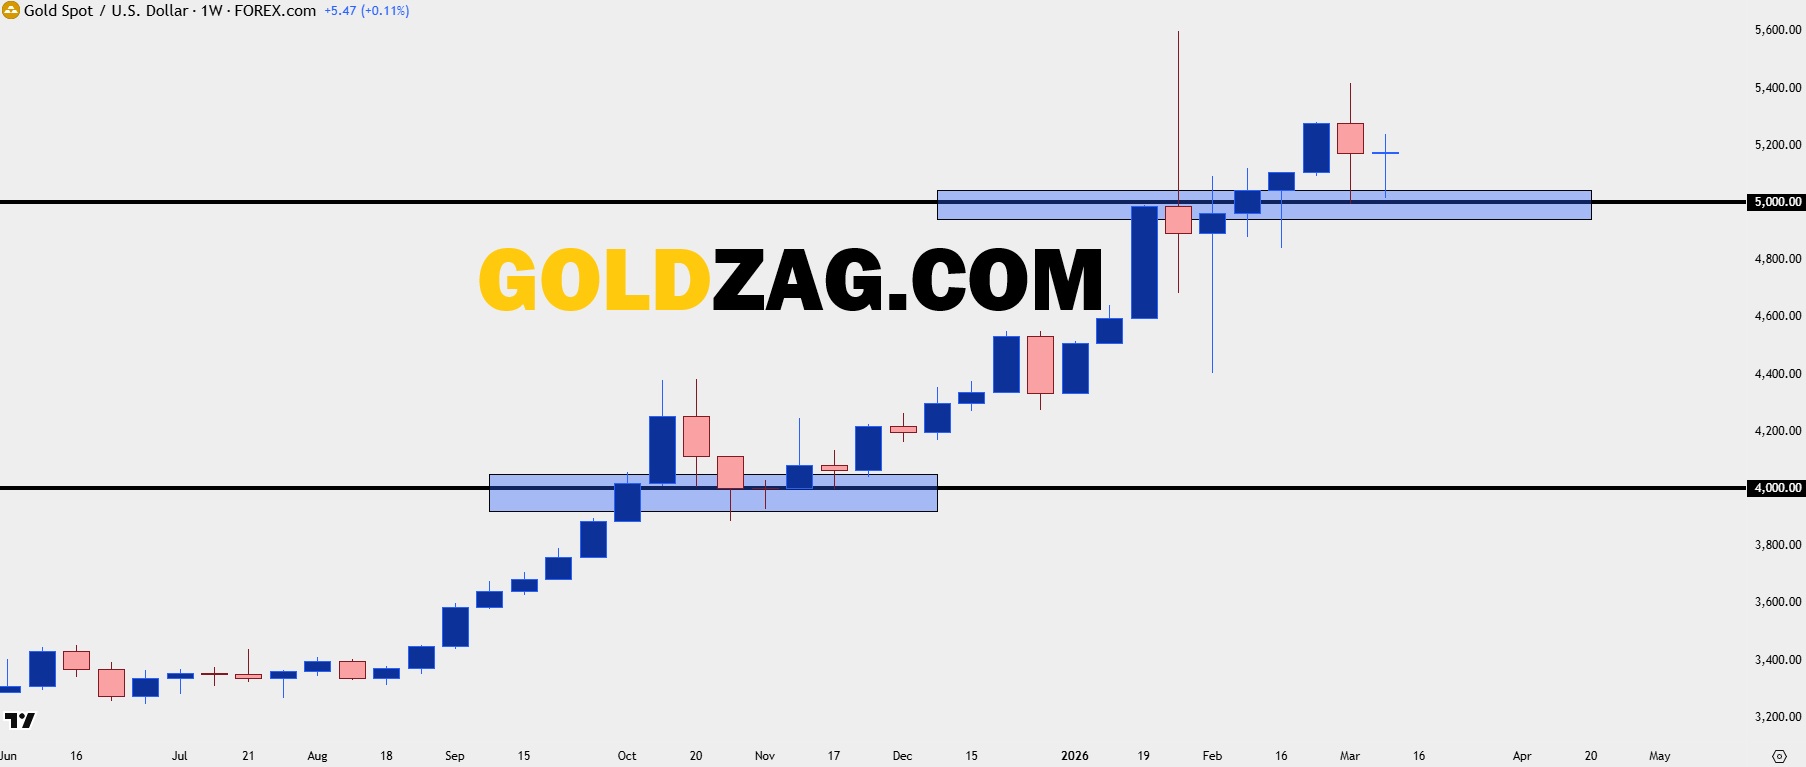
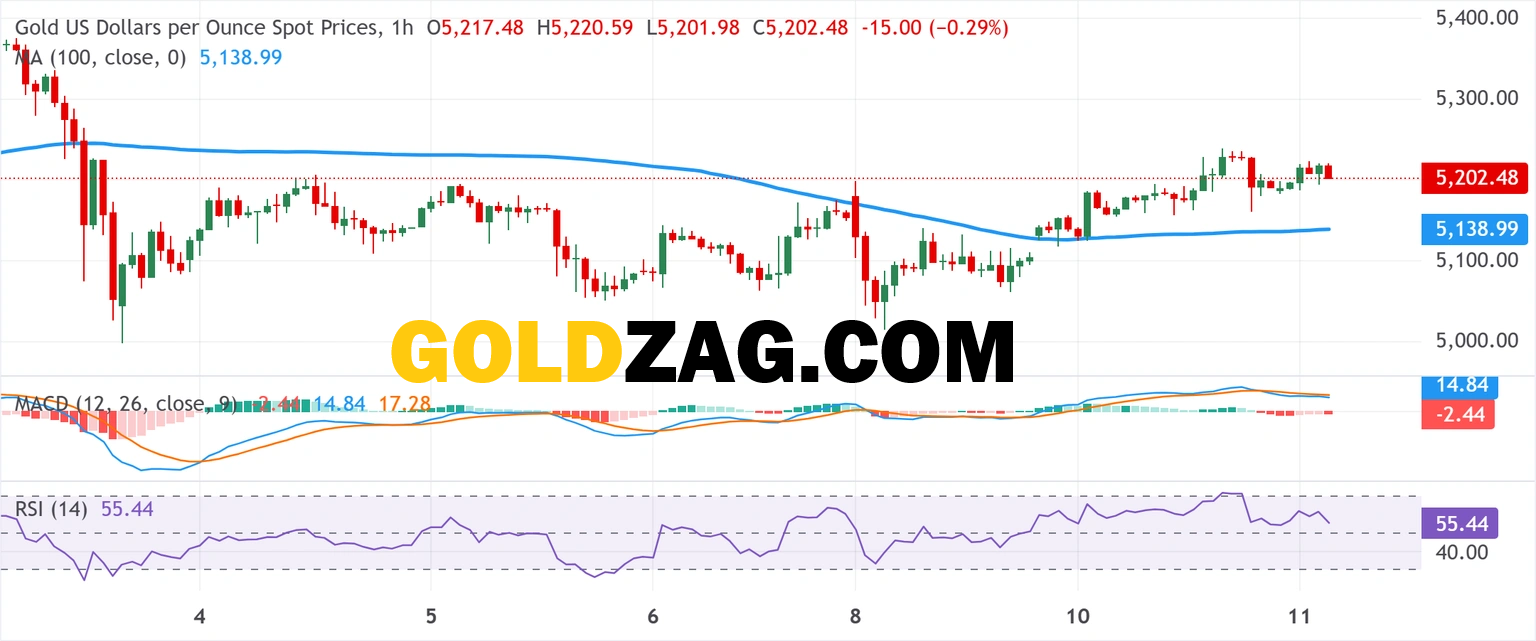
The hourly chart shows gold hovering around the $3333 level, caught between immediate support and resistance. The RSI is trending upward, hinting at increasing buying pressure. The price action suggests a potential breakout from the descending trendline, signaling a possible bullish reversal. Key resistance levels to watch are around $3361 and $3383. A move above these levels could trigger a more significant rally. Support lies in the $3316 and $3294 regions.
According to technical analysis, the upward break of the RSI suggests an imminent rally.
Market Drivers and Sentiment
Market sentiment plays a crucial role in gold's price movements. The current Fear & Greed Index of 41/100 suggests that investors are exhibiting moderate fear, which can often drive safe-haven assets like gold. Keep an eye on economic data releases and geopolitical events, which can quickly shift market sentiment and impact gold prices. The relatively flat daily change indicates a period of consolidation, potentially setting the stage for a more decisive move.
For a deeper understanding of how global events affect gold, explore our comprehensive gold market glossary.
Investment Strategies for 2025
Given the current market conditions, consider the following strategies for gold investment in 2025:
- Short-Term Trading: Capitalize on potential breakouts by monitoring key resistance and support levels.
- Long-Term Accumulation: Take advantage of price dips to build a long-term gold position.
- Diversification: Allocate a portion of your portfolio to gold as a hedge against economic uncertainty.
Stay ahead of the curve with our real-time gold price alerts.
FAQ
What is the current gold price today?
As of 01:37 UTC on August 19, 2025, the current gold price is $3333.4.
What factors are influencing the gold price today?
The gold price is influenced by a combination of technical factors, market sentiment (Fear & Greed Index at 41/100), and broader economic conditions. See Investopedia for broad economic data.
Seize the moment: Monitor gold prices and trends to find smart investments!
Disclaimer: This analysis is for informational purposes only and does not constitute investment advice.
Written by
Emily White
Investment Education Specialist
Emily White is dedicated to demystifying the world of finance for the everyday investor. With a background in both education and personal finance advisory, she excels at breaking down complex topics like portfolio allocation, risk management, and investment product comparison into simple, actionable steps. Emily is the lead creator of the GoldZag Academy, where her work has empowered thousands of new investors to begin their journey into precious metals with confidence and clarity. She is passionate about promoting financial literacy for all.