Gold Price Analysis: Navigating Consolidation at Key Levels - XAU/USD Outlook
By Alex Burry on February 16, 2026
8,772 views
Key Takeaways
- Monitor key support and resistance levels for potential breakout or breakdown signals in the XAU/USD.
- The current Fear & Greed Index reading of 74 indicates a bullish sentiment, but be wary of potential overbought conditions.
- Stay informed about macroeconomic factors that could influence gold prices, such as interest rate decisions and inflation data.
- Consider setting up price alerts to capitalize on potential price swings. Use our free tool to track the real-time value of your investments.
Gold Price Analysis: Consolidation with Key Levels in Focus
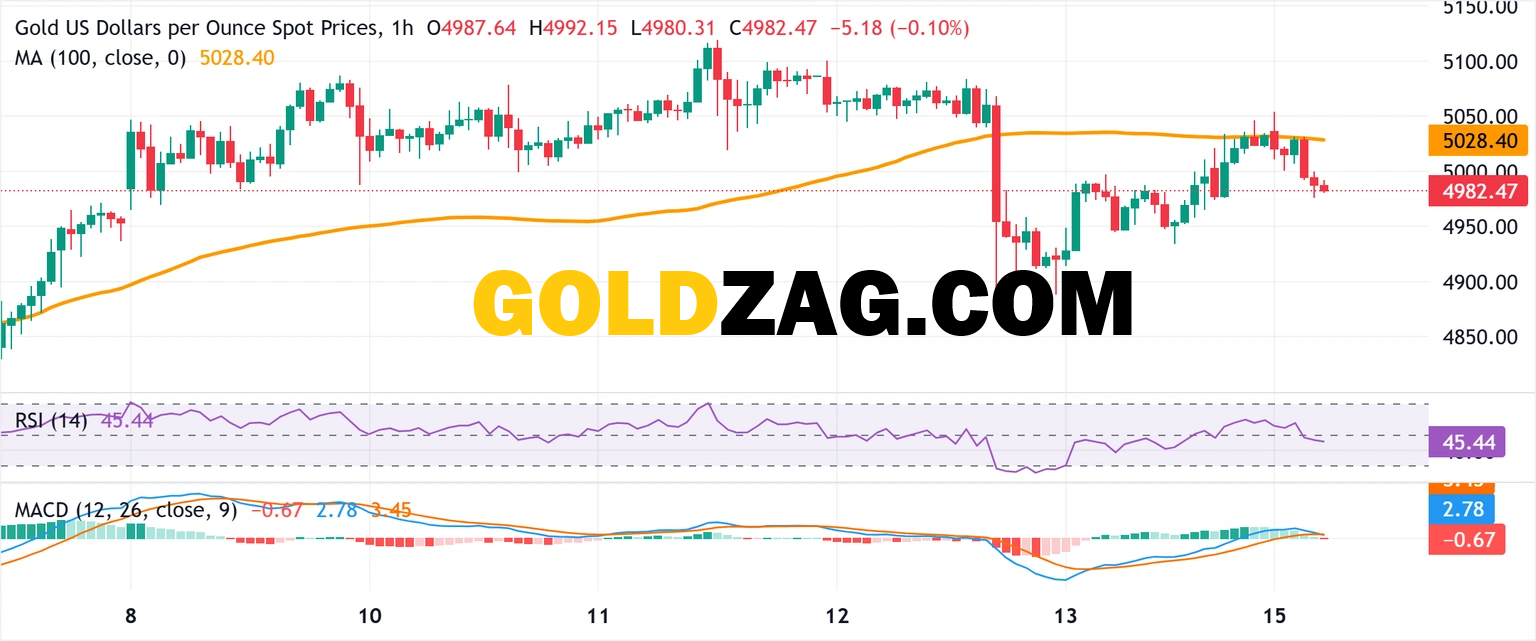
Let's break down the numbers. The precious metals market is currently exhibiting a period of consolidation, and gold is no exception. As Chief Market Analyst, I'm here to provide a data-driven perspective on the current state of the gold price today. Understanding the technicals is paramount for navigating these market conditions. My analysis will give you clear, actionable insights into the current gold price and potential future movements.
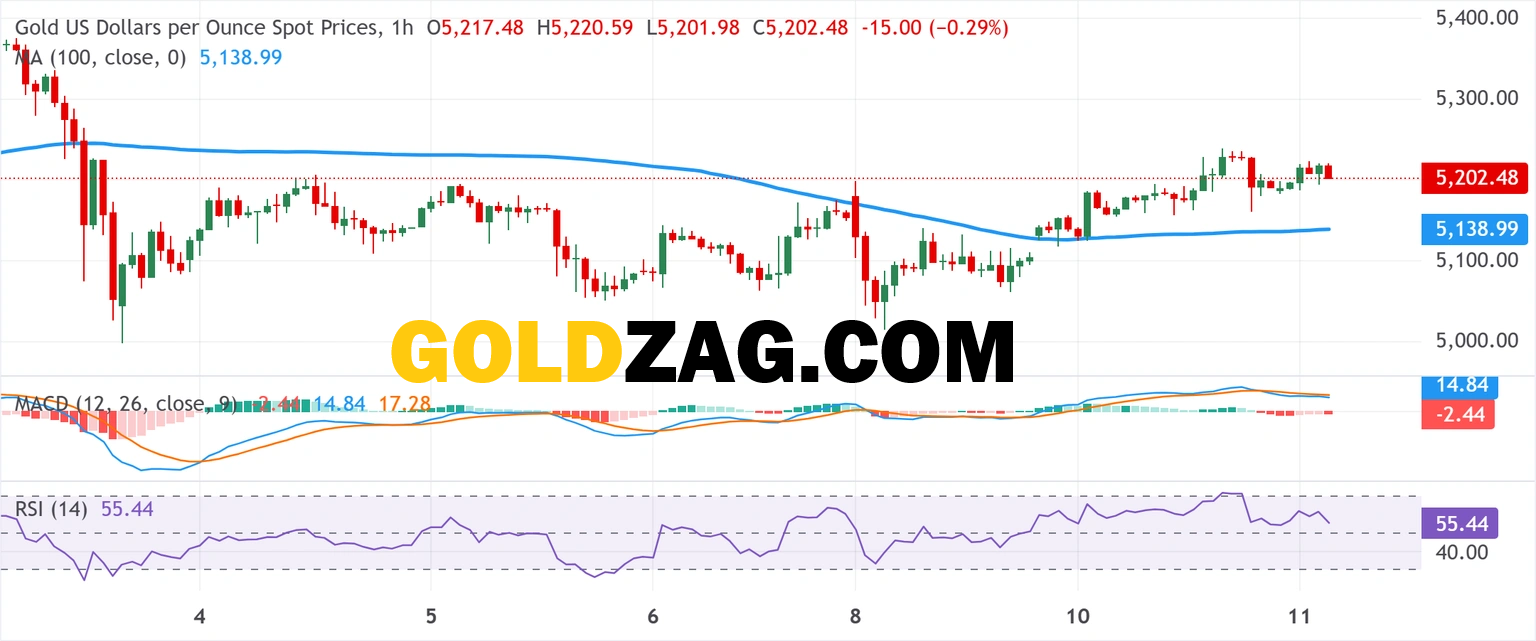
At the time of writing, the live gold price is hovering around $5014.04 per ounce. Compared to the previous day's close of $5041.8, this represents a decrease of $27.758, or -0.551%. While this might seem like a minor fluctuation, it's crucial to put it into the context of broader market trends and key technical levels.
The Fear & Greed Index currently stands at 74 out of 100. This indicates a 'greed' sentiment, suggesting that investors are generally optimistic. However, high levels of greed can sometimes be a contrarian indicator, signaling a potential market correction. Investors need to balance enthusiasm with caution, as periods of high greed can precede pullbacks.
Technical Outlook
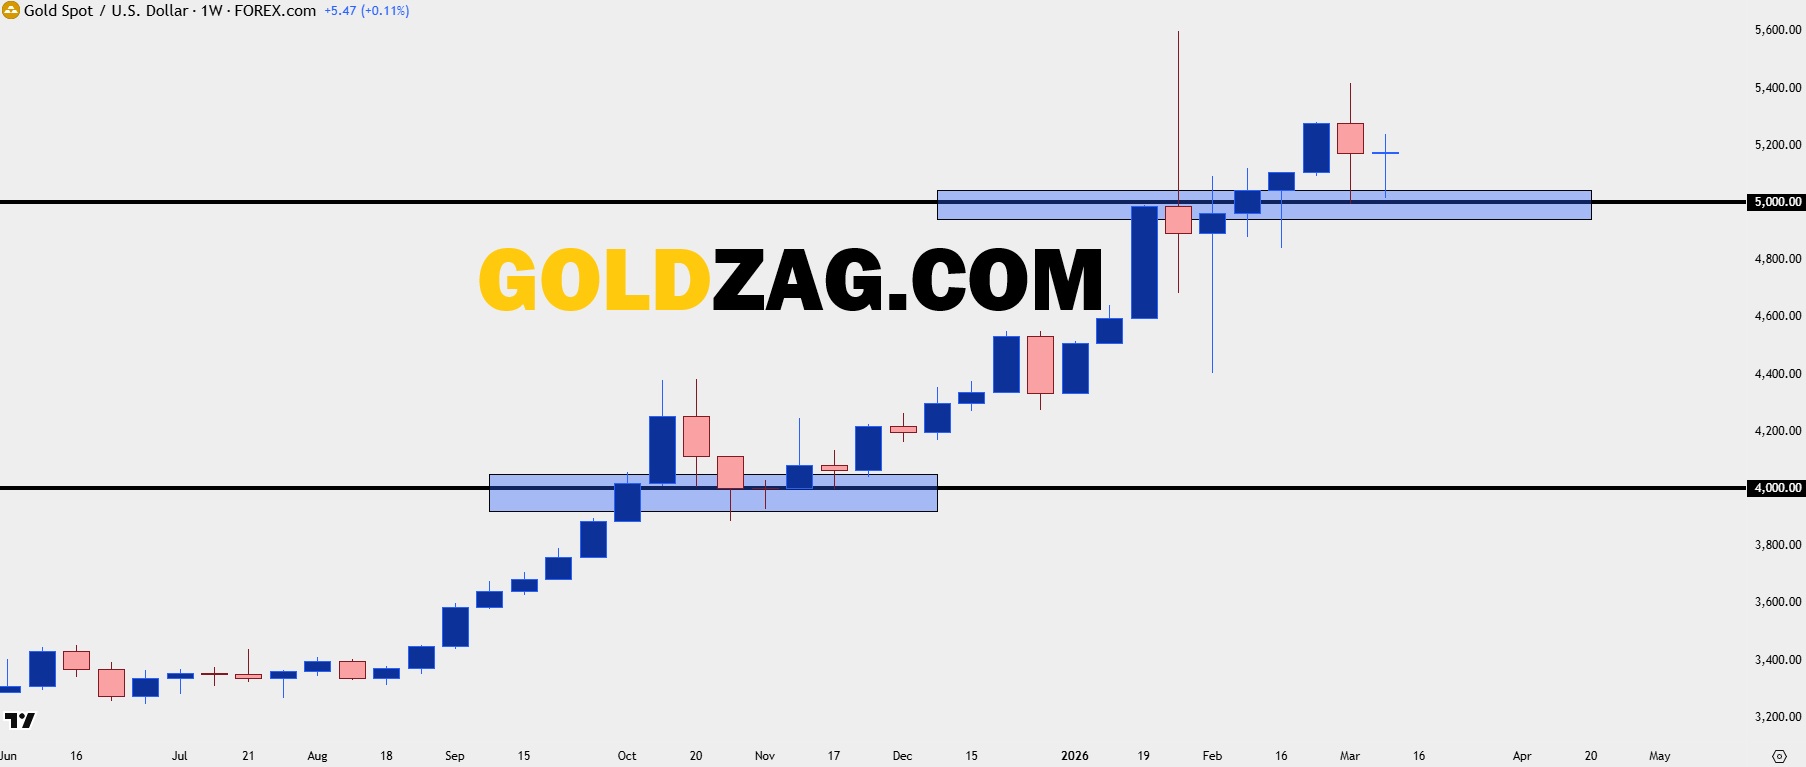
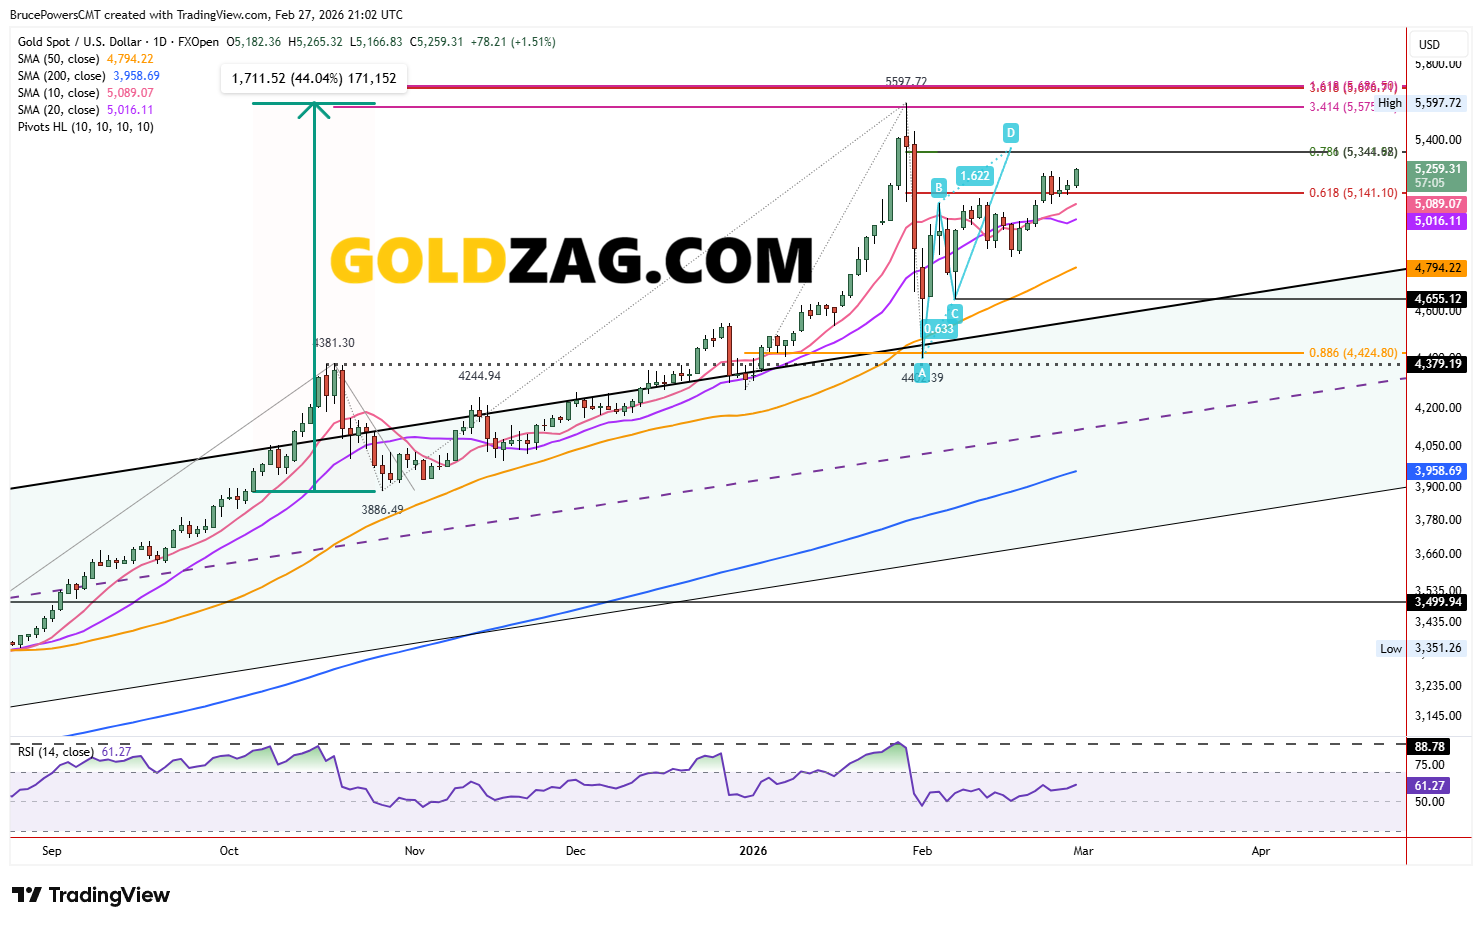
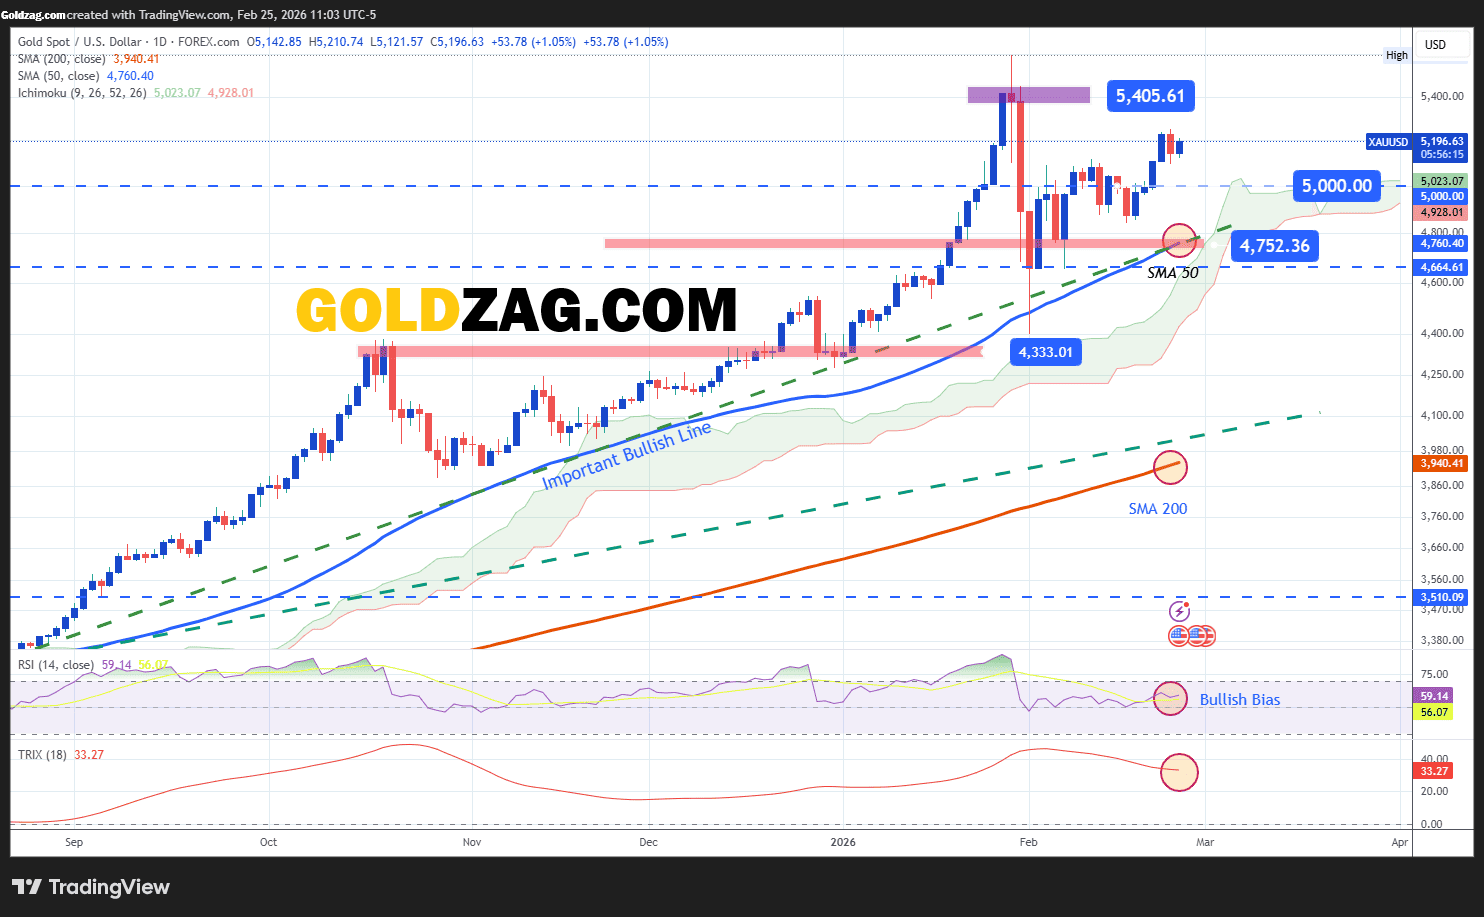
Let's dive into the technicals. A closer look at the chart reveals key support and resistance levels that are currently defining the trading range for XAU/USD. Understanding these levels is crucial for anticipating potential breakout or breakdown scenarios.

Based on this chart, we can observe a defined trading range. The upper resistance is forming a tough barrier to crack through. A break above this level could signal a move towards higher prices, while a drop below the support could trigger further selling pressure. The moving averages are showing a slowing of upward momentum.
Market Drivers and Sentiment
Several factors are currently influencing the gold market trends. Keep an eye on macroeconomic data releases, particularly inflation figures and interest rate decisions from major central banks. Rising interest rates can often put downward pressure on gold prices, as they increase the opportunity cost of holding non-yielding assets like gold. Conversely, concerns about inflation or economic uncertainty can boost demand for gold as a safe-haven asset. For more insights into how these factors impact gold, resources like Investopedia offer valuable information.
Investor sentiment also plays a significant role. As indicated by the Fear & Greed Index, a generally optimistic outlook prevails. This could be fueled by expectations of continued economic growth or hopes for a resolution to geopolitical tensions. However, it's important to remember that sentiment can shift quickly, and unexpected events can trigger sharp price movements.
Alternative Scenario
While the current technical picture suggests continued consolidation, it's crucial to consider alternative scenarios. A surprise shift in monetary policy, a sudden escalation of geopolitical tensions, or a significant economic downturn could all trigger a sharp move in gold prices. Stay flexible and adapt your strategy as new information becomes available. Remember to check our historical value calculator.
Gold Price Forecast
Given the current consolidation pattern, a definitive gold price forecast is challenging. However, monitoring the key support and resistance levels will provide valuable clues. A decisive break above resistance could signal a move towards higher targets, while a breakdown below support could pave the way for further declines. The gold price per ounce depends heavily on these breaks. Consider setting up AI-powered price alerts for precious metals.
Keep an eye on the gold price in USA and gold price in UK, as these major markets often drive global price trends. Additionally, the gold price in India is another key indicator to watch due to its significant gold consumption.
FAQ
What is the current gold price and how has it changed today?
At the time of this analysis, the gold price was $5014.04 per ounce, representing a decrease of $27.758 compared to the previous day's close.
What does the Fear & Greed Index indicate about the gold market?
The Fear & Greed Index is currently at 74, indicating a greedy sentiment among investors. This suggests optimism, but also warrants caution as high greed levels can sometimes precede market corrections. Understanding the gold-to-silver ratio can also help.
Ready to take the next step in your gold investment journey? Use our free tool to track the real-time value of your investments.
Disclaimer: This analysis is for informational purposes only and does not constitute investment advice.
Written by
Alex Burry
Chief Market Analyst
With over 15 years of experience on the trading floors of major financial institutions, Alex Burry is a seasoned market analyst specializing in precious metals and commodities. As a Chartered Financial Analyst (CFA), he combines rigorous quantitative analysis with a deep understanding of market psychology. Alex is renowned for his data-driven models that have successfully forecasted major turning points in the gold market. His expert commentary focuses on translating complex technical indicators and market data into clear, actionable insights for both retail and institutional investors.