Gold Price Forecast: Bullish Signals Emerge for XAU/USD – Is the Correction Over?
By Alex Burry on February 03, 2026
7,012 views

Key Takeaways
- Gold's recent price surge indicates a possible bullish reversal.
- Technical analysis suggests a strong support level, reinforcing the bullish outlook.
- The current Fear & Greed Index reflects increased investor confidence in gold.
- Monitor macroeconomic factors and geopolitical events for continued upside potential.
Gold Price Analysis: Bullish Reversal Hints at End of Correction
Let's break down the numbers. The recent price action in gold (XAU/USD) tells a compelling story. After a period of correction, we're seeing strong signals of a potential bullish reversal. The question on every investor's mind: is this the end of the pullback, and are we headed higher?
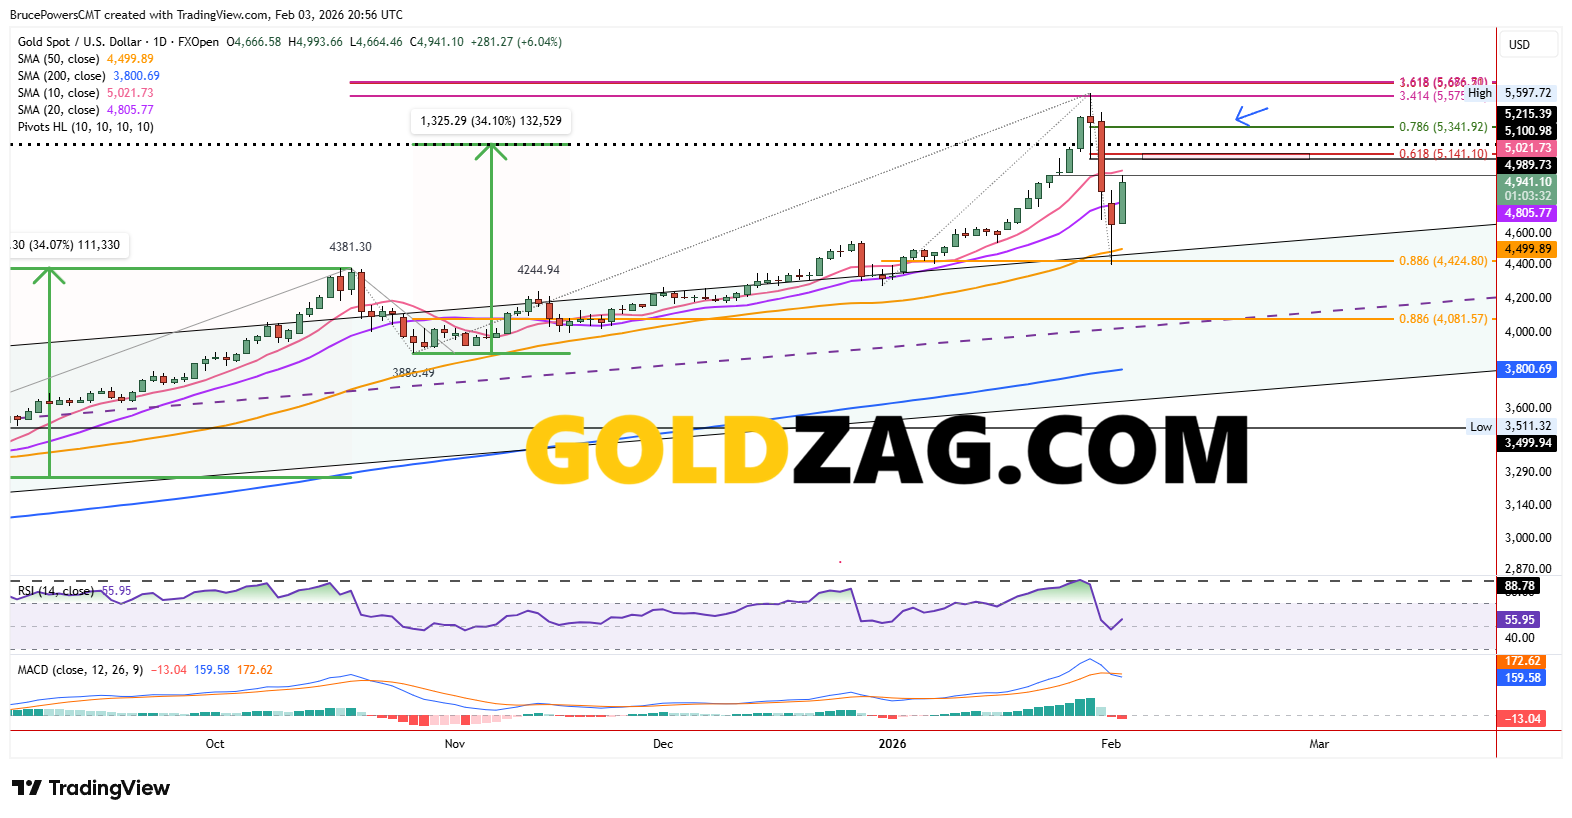
According to the data at the time of analysis, the live gold price stood at $4946.99. The previous day's close was $4633.88, and that represented a change of $313.113, or 6.757%. This significant upward move cannot be ignored.
Market Sentiment
Investor sentiment is also shifting. The Fear & Greed Index currently sits at 59/100. This leaning towards 'Greed' indicates increasing confidence in the market, suggesting that investors are becoming more comfortable with risk and are potentially more willing to allocate capital to assets like gold. Monitor the AI-powered price alerts to stay ahead of the curve.
Technical Outlook
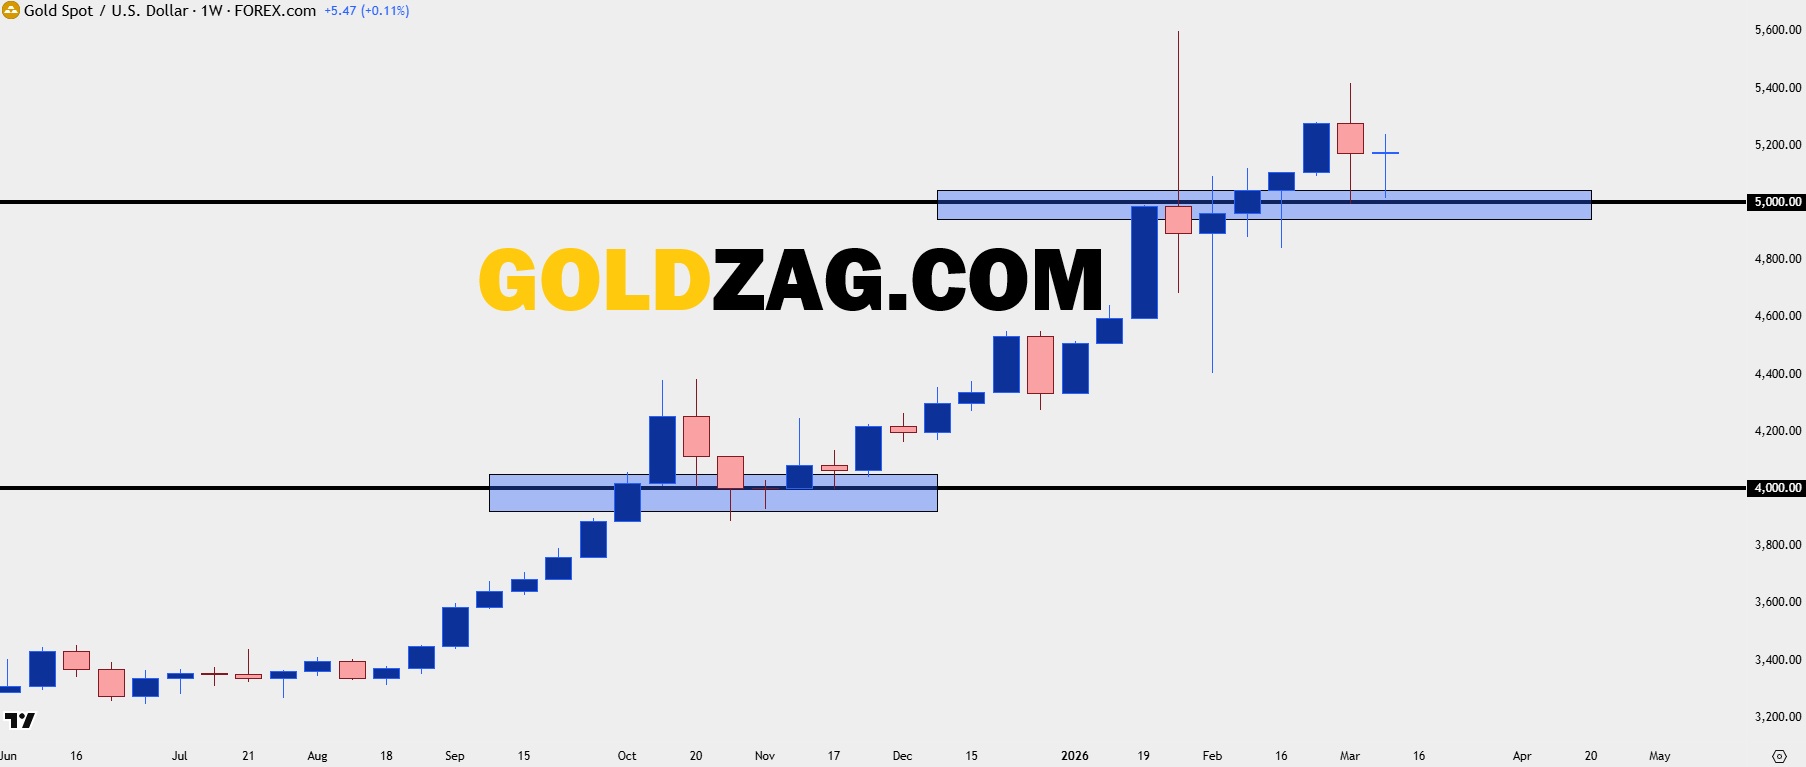
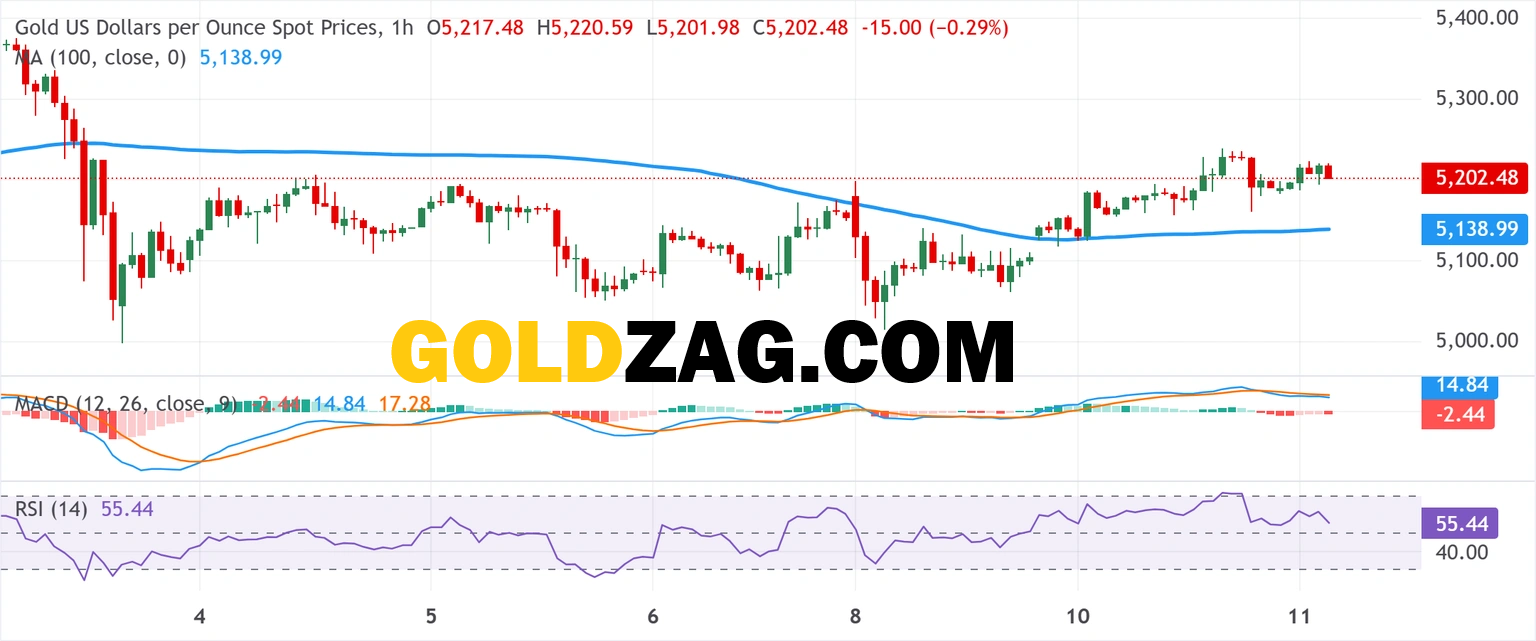
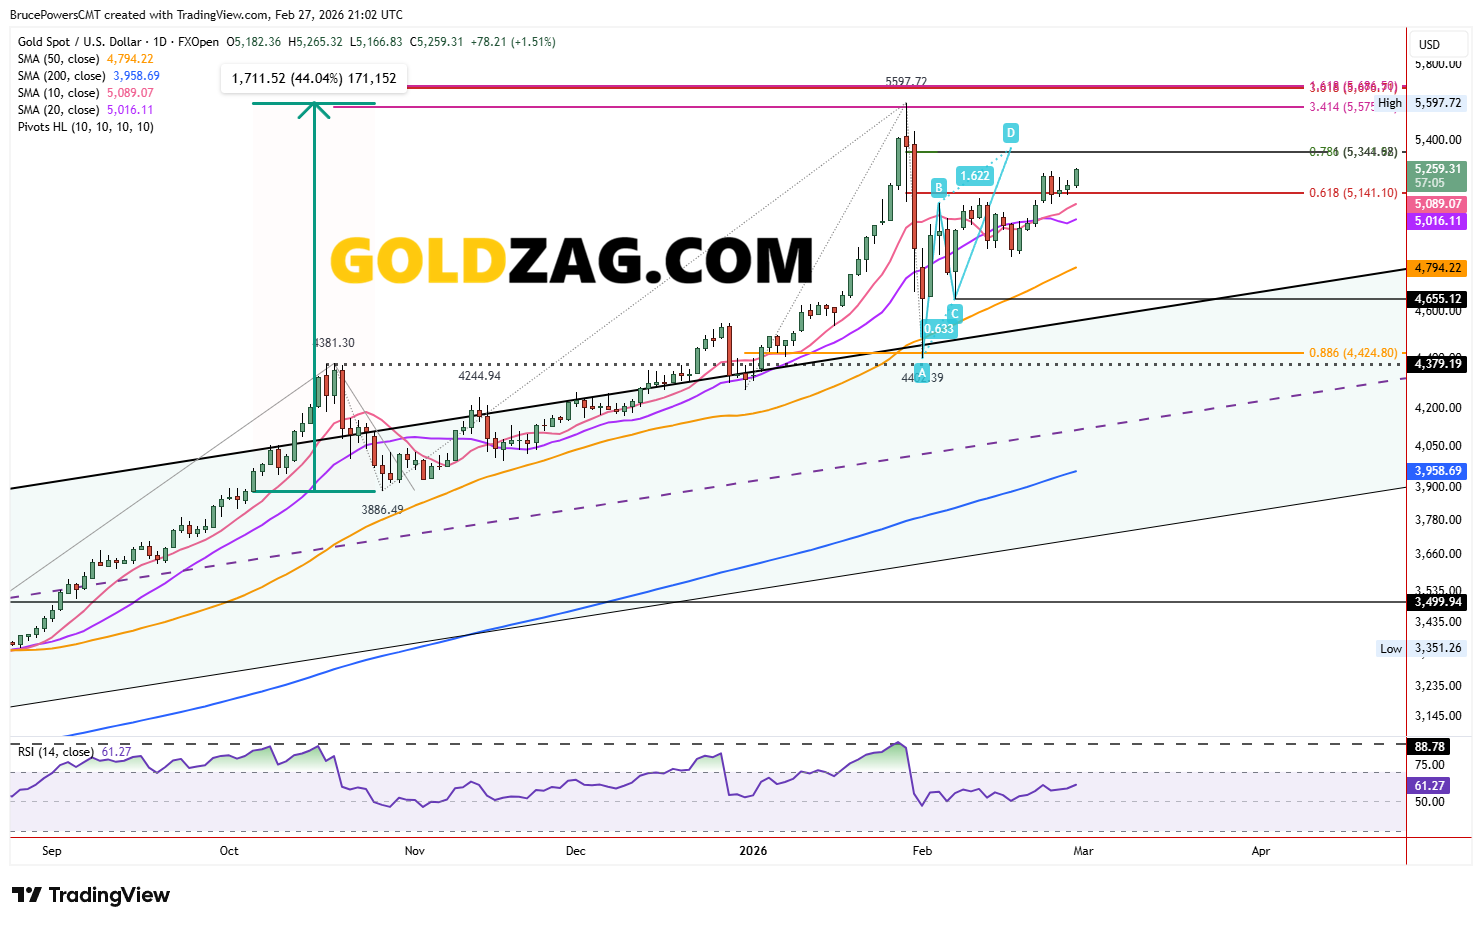
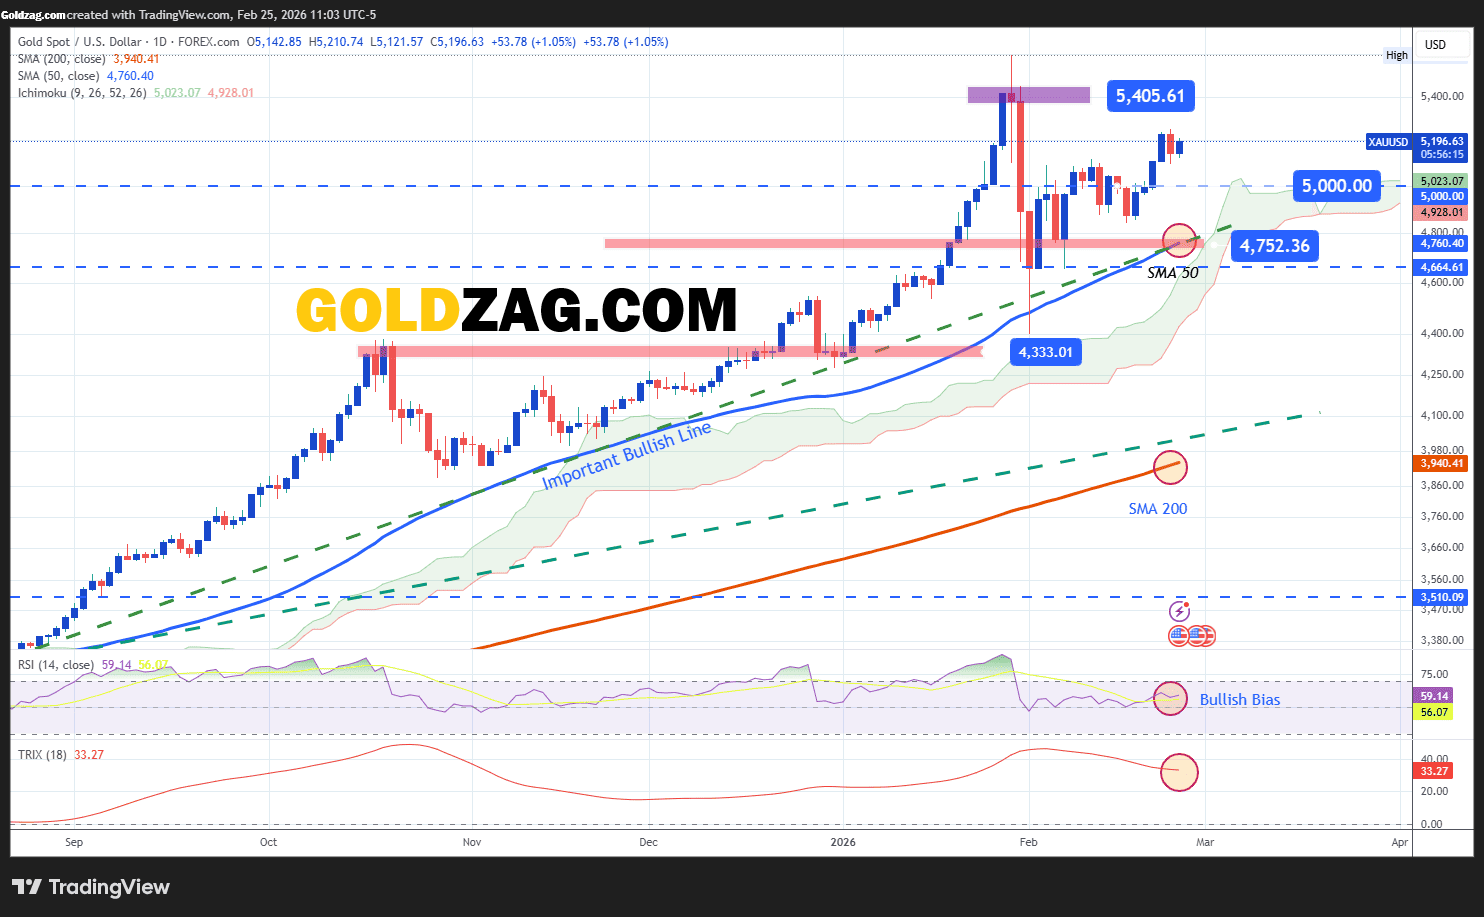
The technical chart reveals several key insights. We're observing a potential breakout above a key resistance level, which could trigger further upside momentum. The Moving Averages are starting to converge, potentially signaling a bullish crossover. The Relative Strength Index (RSI) is also trending upwards, suggesting increasing buying pressure. Key support levels need to hold to confirm this bullish scenario.
Market Drivers
Several factors are likely contributing to this bullish momentum. Concerns about inflation persist, with investors seeking safe-haven assets to protect their capital. Geopolitical tensions also continue to simmer, further boosting gold's appeal. It's crucial to keep an eye on these macroeconomic factors and their potential impact on the current gold price. Remember to use a tool to see how an investment in precious metals could have grown over time. Gold investment in the gold price USA, gold price UK and gold price India markets will react differently.
Alternative Scenario
Of course, no analysis is complete without considering the opposite view. A stronger-than-expected economic recovery could dampen gold's appeal as a safe haven. Furthermore, a sudden shift in monetary policy by central banks could also negatively impact the current gold price. Always consider different scenarios when making investment decisions. Diversify your portfolio and compare the historical performance of gold against Silver and the S&P 500.
The Bigger Picture
Taking a step back, this potential bullish reversal aligns with a broader trend of increasing demand for precious metals. As uncertainty persists in the global economy, gold's safe-haven status continues to support its value. The visual timeline of major events affecting gold prices will help you understand the history behind the market.
The Future of Gold
Given the current technical and fundamental backdrop, my outlook for gold remains bullish in the long term. While short-term volatility is always possible, the underlying drivers supporting gold's value appear firmly in place. Gold acts as a hedge against inflation. According to Investopedia, gold is often used as a hedge against inflation. Written by Chief Market Analyst With over 15 years of experience on the trading floors of major financial institutions, Alex Burry is a seasoned market analyst specializing in precious metals and commodities. As a Chartered Financial Analyst (CFA), he combines rigorous quantitative analysis with a deep understanding of market psychology. Alex is renowned for his data-driven models that have successfully forecasted major turning points in the gold market. His expert commentary focuses on translating complex technical indicators and market data into clear, actionable insights for both retail and institutional investors.Alex Burry