Gold Price Weekly Forecast: XAU/USD August 18-22, 2025
By Emily White on August 16, 2025
949 views
.jpg?alt=media&token=7e64d3ab-8f49-4a0e-a726-041acefcf73d)
Key Takeaways
- Gold is currently trading at $3335.05, down slightly from the previous day's close.
- The Fear & Greed Index is neutral at 43/100, reflecting balanced market sentiment.
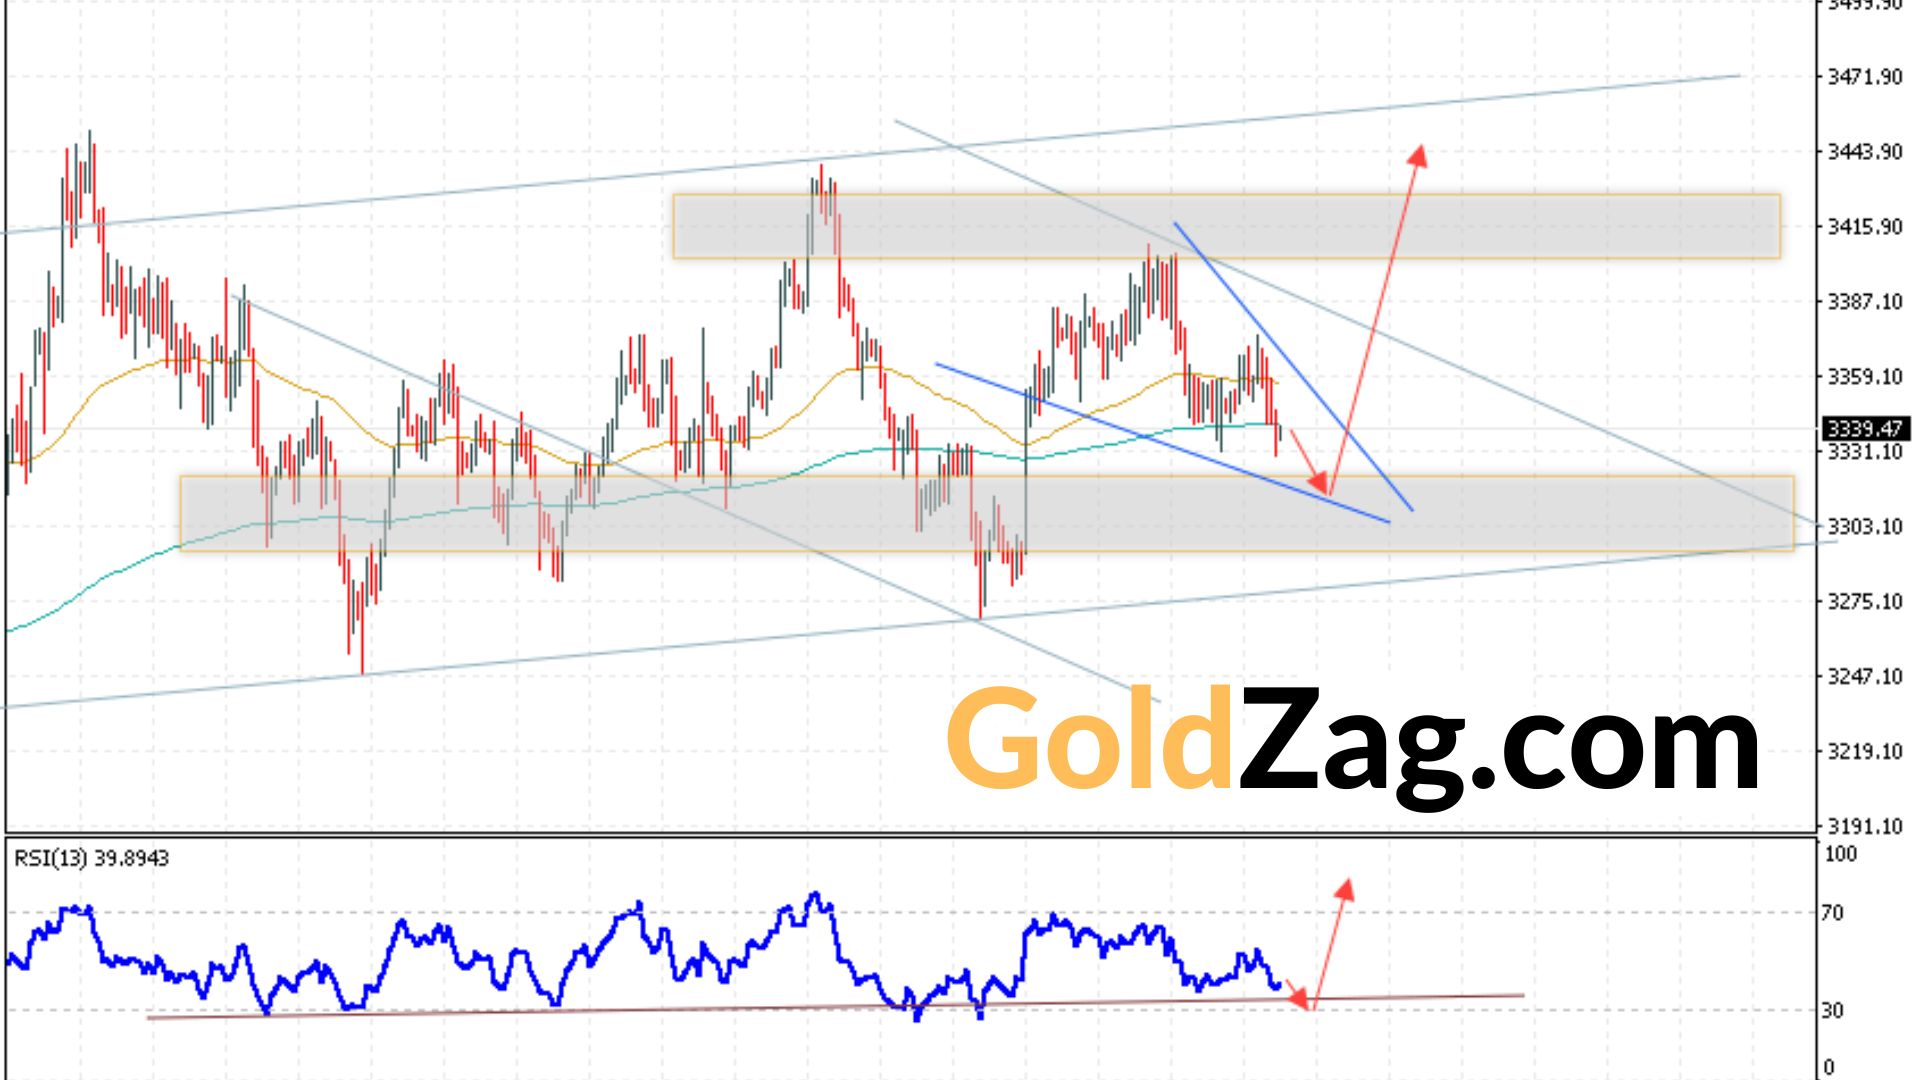
- Technical analysis suggests gold is consolidating within a symmetrical triangle, with potential for a breakout or breakdown.
- Economic indicators and geopolitical developments are likely to influence future price movements.
GOLD Price Weekly Forecast XAU/USD August 18 — 22, 2025
Gold prices are exhibiting slight downward pressure as the week commences, with XAU/USD currently trading at $3335.05 as of 14:51 UTC. This represents a minor dip of $-3.053, or -0.091%, compared to the previous day's close of $3338.11. Investors are closely watching these movements to gauge potential shifts in market sentiment.
Overall market sentiment appears to be neutral, with the Fear & Greed Index registering at 43/100. This suggests a lack of strong conviction in either bullish or bearish directions, creating a cautious trading environment. Traders seeking to protect their investments might find value in our beginner's guide to gold investing, offering insights into risk management and diversification.
Technical Outlook
The technical chart reveals that gold has been trading within an upward channel. The price is currently consolidating near the upper trendline of what appears to be a symmetrical triangle. A potential breakout above this triangle could lead to a significant rally, targeting higher resistance levels. Conversely, a breakdown below the lower trendline might trigger a correction towards the support zone around $3266.45, the Relative Strength Index (RSI) shows a slightly positive divergence, suggesting potential bullish momentum building up.
The trend remains bullish overall, supported by key moving averages. However, traders should monitor price action closely for confirmation signals before initiating new positions. Understanding how to calculate gold purity can further aid investment decisions, ensuring quality and value.
Market Sentiment and Economic Indicators
The current market sentiment, as reflected by the Fear & Greed Index, indicates a lack of strong directional bias. Investors are likely awaiting further economic data releases and geopolitical developments to provide clearer signals. Trade policy uncertainty often bolsters gold's safe-haven appeal. For those seeking continuous updates, our AI-powered price alerts can provide timely notifications.
Gold's recent behavior suggests a consolidation phase, with traders hesitant to take on significant risk. Economic indicators will likely play a crucial role in determining the next major price movement. Keep an eye on our free portfolio tracker, to stay on top of your assets.
Furthermore, ongoing inflationary pressures and global economic uncertainties continue to underpin gold's appeal as a store of value. According to Investopedia, gold is often seen as a hedge against inflation and currency devaluation.
Forecast and Trading Strategy
Given the current technical setup and market sentiment, gold is expected to remain range-bound in the near term, testing both support and resistance levels. A breakout from the symmetrical triangle pattern will likely dictate the next directional move. Traders should consider implementing strategies that capitalize on potential breakouts or breakdowns, while also remaining vigilant to shifts in market sentiment and economic data.
Written by
Emily White
Investment Education Specialist
Emily White is dedicated to demystifying the world of finance for the everyday investor. With a background in both education and personal finance advisory, she excels at breaking down complex topics like portfolio allocation, risk management, and investment product comparison into simple, actionable steps. Emily is the lead creator of the GoldZag Academy, where her work has empowered thousands of new investors to begin their journey into precious metals with confidence and clarity. She is passionate about promoting financial literacy for all.