Gold and Silver Prices Surge: Is the Bull Market Back? XAU/USD Technical Analysis
By Alex Burry on October 11, 2025
1,484 views
Key Takeaways
- Gold's breakout above $4000 signals a potential continuation of the upward trend.
- The high Fear & Greed Index suggests caution, as markets may be overbought.
- Monitor key support and resistance levels for potential entry and exit points.
- Consider diversifying your precious metals portfolio to mitigate risk.
Gold and Silver Rebound: Record Prices Reshape Bullion Markets
The gold market is ablaze with activity as prices surge to unprecedented levels. The current gold price stands at $4017.18 (as of 10:53 UTC), a significant jump from the previous day's close of $3960.55. This translates to a $56.625 increase, or a 1.43% rise. The surge isn't isolated to gold; silver is also experiencing a notable upswing. Investors worldwide are closely watching these movements, assessing whether this rally signifies the start of a sustained bull market or a temporary peak.
The precious metals market is driven by a complex interplay of factors, including macroeconomic trends, geopolitical events, and investor sentiment. Concerns about inflation, currency devaluation, and global economic uncertainty are all contributing to the increased demand for gold as a safe-haven asset. Additionally, central bank policies and interest rate decisions play a crucial role in shaping the landscape for gold investment.
Technical Outlook for XAU/USD
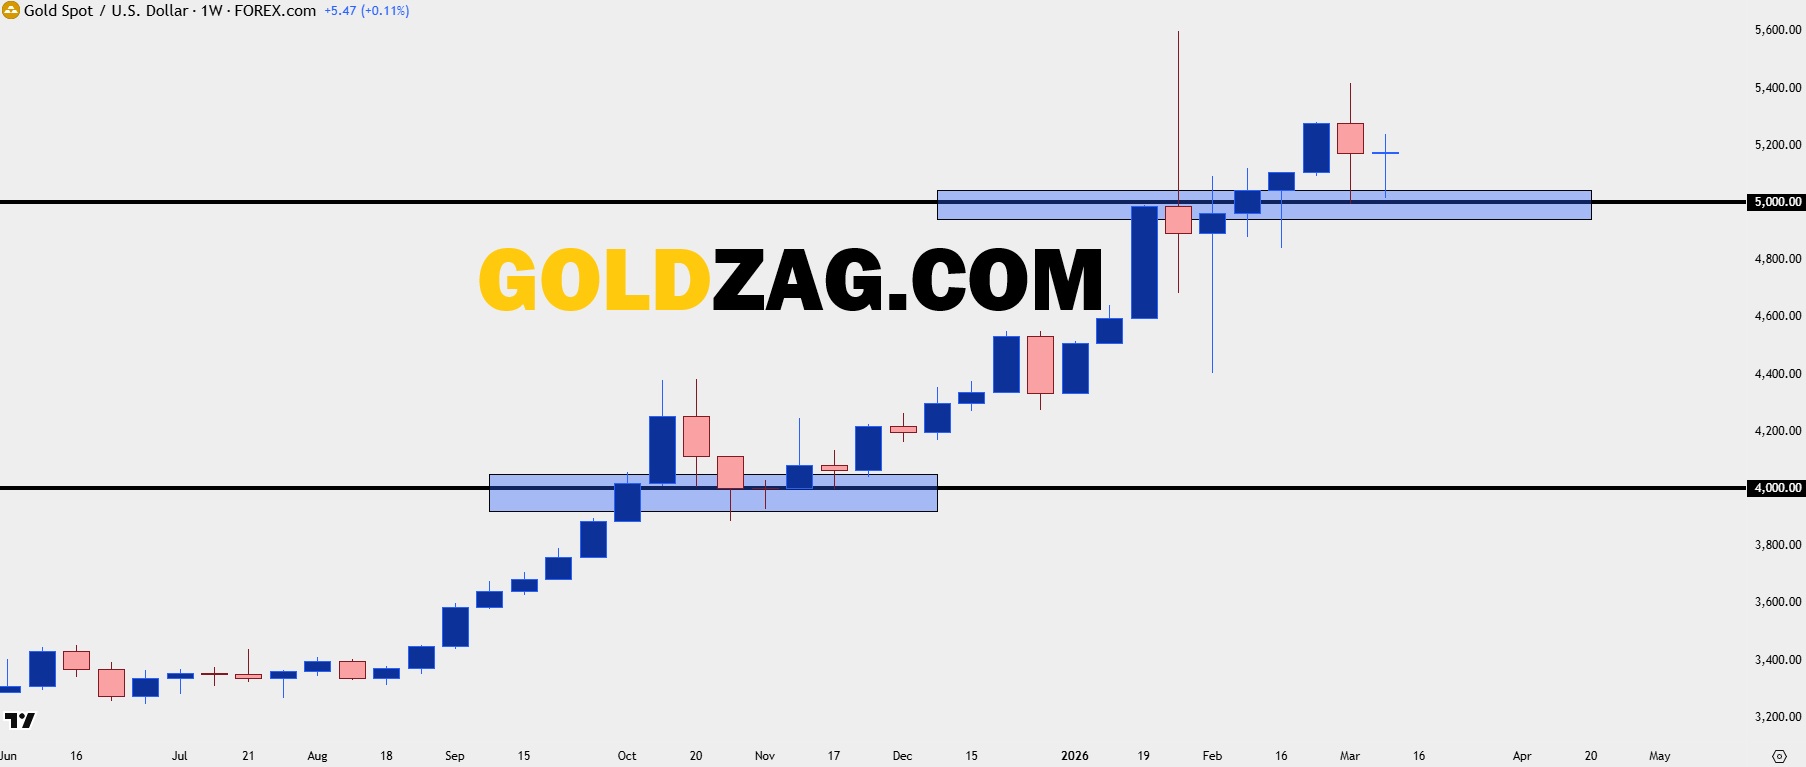
From a technical perspective, the recent breakout above the $4000 mark is a significant development for XAU/USD. This breach of a key psychological level could pave the way for further gains in the short to medium term. However, traders should exercise caution, as the market may become overbought in the near future. Analyzing key support and resistance levels is crucial for making informed trading decisions.

The chart above illustrates the recent price action in the gold market. Notice the strong upward momentum, as indicated by the series of higher highs and higher lows. However, the Relative Strength Index (RSI) is approaching overbought territory, suggesting a potential pullback or consolidation phase. Key support levels to watch include $3950 and $3900, while resistance levels can be found at $4050 and $4100. Monitoring the moving averages (e.g., 50-day and 200-day EMAs) can also provide valuable insights into the prevailing trend.
Contrarian View
While the technical indicators suggest a bullish outlook for gold, it's important to consider alternative scenarios. A sudden shift in monetary policy, such as an unexpected interest rate hike by the Federal Reserve, could trigger a sharp correction in gold prices. Additionally, a significant improvement in global economic growth could diminish gold's appeal as a safe-haven asset. Always consider various perspectives and manage your risk accordingly.
Market Drivers & Sentiment
Investor sentiment is currently running high, as reflected in the Fear & Greed Index reading of 88/100. This indicates extreme greed, suggesting that the market may be vulnerable to a correction. When fear is low and greed is high, investors tend to be overly optimistic, potentially leading to irrational exuberance. Conversely, when fear is high and greed is low, investors become more risk-averse, often presenting opportunities for value investors. You can set up AI-powered price alerts for gold to stay on top of the volatility.
Macroeconomic factors, such as inflation and interest rates, are also playing a significant role in driving gold prices. Rising inflation erodes the purchasing power of fiat currencies, making gold a more attractive store of value. Conversely, rising interest rates tend to dampen demand for gold, as they increase the opportunity cost of holding a non-yielding asset. Keep track of your gold assets using Our free tool to track the real-time value of your gold investments.
Global Gold Market Trends
The surge in gold prices is not limited to the USA; it's a global phenomenon. Demand for gold is increasing across various regions, including Asia, Europe, and the Middle East. Central banks are also accumulating gold reserves, further supporting the upward trend. Factors such as geopolitical tensions, currency fluctuations, and trade wars are all contributing to the increased demand for gold worldwide. Stay informed about the A visual timeline of major events affecting gold prices.
The gold price today is a reflection of global economic uncertainty and heightened investor demand. As the world navigates through these turbulent times, gold is likely to remain a sought-after asset for investors seeking to preserve their wealth. You can analyze the current and historical Gold-to-Silver ratio using Our free tool to track the real-time value of your gold investments. to see if this might be a good time to diversify into silver.
Gold Price Forecast
Predicting the future gold price with certainty is impossible, but analyzing current trends and market drivers can provide valuable insights. The current momentum suggests that gold prices could continue to rise in the short to medium term. However, investors should be prepared for potential volatility and corrections along the way. Managing risk and diversifying your portfolio are essential for navigating the uncertainties of the gold market. Expert sources like Reuters provide additional perspectives on market movements.
FAQ
What is the current gold price per ounce?
As of 10:53 UTC, the current gold price per ounce is $4017.18.
Is now a good time for gold investment?
The Fear & Greed Index is at 88/100 indicating extreme greed. While the gold price is currently trending upwards, high levels of greed can indicate the market is overbought, so proceed with caution. Consider diversifying your portfolio and consulting with a financial advisor.
Ready to invest in gold? Explore our academy to learn more!
Disclaimer: This analysis is for informational purposes only and does not constitute investment advice.
Written by
Alex Burry
Chief Market Analyst
With over 15 years of experience on the trading floors of major financial institutions, Alex Burry is a seasoned market analyst specializing in precious metals and commodities. As a Chartered Financial Analyst (CFA), he combines rigorous quantitative analysis with a deep understanding of market psychology. Alex is renowned for his data-driven models that have successfully forecasted major turning points in the gold market. His expert commentary focuses on translating complex technical indicators and market data into clear, actionable insights for both retail and institutional investors.