Gold Price Forecast for the Week of November 16 – 20, 2026
Week 47, 2026 · Published November 14, 2026
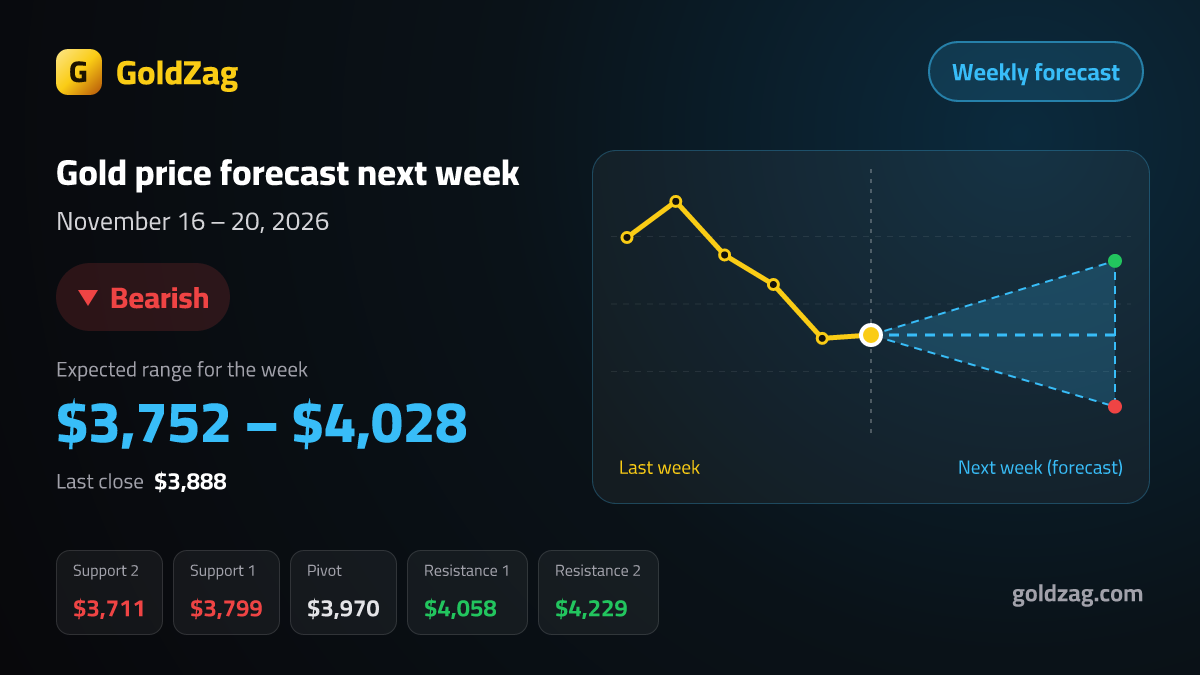
Bias for the week
Bearish
- Last close vs 20-day average ($4,020)Bearish
- 20-day vs 50-day average ($4,158)Bearish
- Change over 4 weeks (−6.65%)Bearish
Most signals point down: sellers start the week in control. A weekly close above $4,058 would weaken this view.
Expected range for the week
$3,752 – $4,028
From last Friday's close of $3,888, gold moves about ±3.5% in a typical week (based on the last 20 trading days). That gives an expected range of $3,752 to $4,028: about two weeks in three close inside it.
The result of this forecast will be added here on November 21, 2026, together with the weekly report.
Key levels for the week (pivot points)
Resistance 2
$4,229
Resistance 1
$4,058
Pivot
$3,970
Support 1
$3,799
Support 2
$3,711
Scenarios
- Bullish scenario: a move above $4,058 would open the way to $4,229.
- Bearish scenario: a drop below $3,799 would expose $3,711.
- The pivot at $3,970 separates the two: trading above it favours buyers, below it favours sellers.
Analyst outlook for the week
Gold closed last Friday at 3888 USD per troy ounce, recording a loss of -4.53% for the week and -6.65% over four weeks. The technical picture presents a bearish bias with a score of -3 out of ±3, as prices remain below the 20-day average of 4020 and the 50-day average of 4158. For week 47 of 2026, November 16–20, 2026, the expected range sits between 3752 and 4028, reflecting a typical weekly move of ±3.5%. With the pivot at 3970, probability favors key levels for directional continuation. A clear break above resistance R1 at 4058 would open the way higher toward R2 at 4229. Conversely, falling below support S1 at 3799 would open the way lower toward S2 at 3711. Please remember that this technical outlook is for informational purposes only and does not constitute financial advice.
Written with AI from the figures on this page only.
Expected gold price per gram by country (November 16 – 20, 2026)
The expected range converted at last Friday's exchange rates (pure gold value, without making charges).
| Country | 21K per gram | 24K per gram |
|---|---|---|
| USA | 106 – 113 USD | 121 – 129 USD |
| UK | 79.90 – 85.77 GBP | 91.32 – 98.02 GBP |
| United Arab Emirates | 388 – 416 AED | 443 – 476 AED |
| India | 9,951 – 10,681 INR | 11,372 – 12,207 INR |
| Saudi Arabia | 396 – 425 SAR | 452 – 486 SAR |
| Egypt | 5,648 – 6,062 EGP | 6,454 – 6,928 EGP |
| Morocco | 1,050 – 1,128 MAD | 1,200 – 1,289 MAD |
| Kuwait | 32.87 – 35.29 KWD | 37.57 – 40.33 KWD |
| Qatar | 384 – 412 QAR | 439 – 471 QAR |
| Jordan | 74.84 – 80.34 JOD | 85.53 – 91.81 JOD |
| Pakistan | 29,197 – 31,341 PKR | 33,368 – 35,818 PKR |
| Turkey | 5,327 – 5,719 TRY | 6,089 – 6,536 TRY |
| France | 95.78 – 102.81 EUR | 109 – 117 EUR |
| Canada | 151 – 162 CAD | 172 – 185 CAD |
| Mexico | 1,957 – 2,101 MXN | 2,237 – 2,401 MXN |
| Spain | 95.78 – 102.81 EUR | 109 – 117 EUR |
| Argentina | 163,197 – 175,182 ARS | 186,510 – 200,208 ARS |
| Colombia | 350,724 – 376,481 COP | 400,827 – 430,264 COP |
Plan your next move
Questions about next week's gold price
Will gold go up or down in the week of November 16 – 20, 2026?
The technical bias is bearish: gold closed at $3,888, below its 20-day average ($4,020), and most signals point down. A move above $4,058 would favour a rise toward $4,229; a drop below $3,799 would favour a fall toward $3,711. Nobody can know the direction for sure.
What is the expected gold price range for November 16 – 20, 2026?
Based on the typical weekly move of ±3.5%, gold is expected to trade between $3,752 and $4,028 per ounce. About two weeks in three close inside such a range.
What is the expected price of 21K gold in the USA for November 16 – 20, 2026?
If gold stays in its expected range, 21K gold in the USA would be between 105.56 USD and 113.31 USD per gram, and 24K between 120.64 USD and 129.50 USD per gram (pure gold value, at last Friday's exchange rate).
How accurate are GoldZag's weekly gold forecasts?
Over the last 5 weeks, gold closed inside our expected range 1 times, and the bias was right 3 times. Each forecast page shows its result once the week is over.
Track record of our weekly forecasts
Over the last 5 weeks, gold closed inside our expected range 1 times and the bias was right 3 times.
How this forecast is calculated
The forecast uses only prices known at the Friday close before the week: the expected range is the typical weekly move (standard deviation of the last 20 daily moves, scaled to 5 days), the levels are classic weekly pivot points from last week's highest close, lowest close and Friday close, and the bias combines three signals (last close vs 20-day average, 20-day vs 50-day average, 4-week change). It is published every Saturday and never edited afterwards.
This forecast is a statistical estimate from past prices, not financial advice. Gold can move outside the expected range, especially after unexpected news.